Showing posts with label 2016 general election. Show all posts

Thursday, October 13, 2016

Updated Numbers of NC's Absentee by Mail-In Ballots as of 10-13-16

So far, over 141,000 mail-in absentee ballots have been requested by North Carolina voters, with 40 percent of the requests coming from registered Republicans, 32 percent from registered Democrats, 28 percent from registered unaffiliated voters, and less than one percent from registered Libertarians.


Among those who have requested mail-in ballots and comparing them to four years ago (same day totals of ballots sent out by county board of elections):


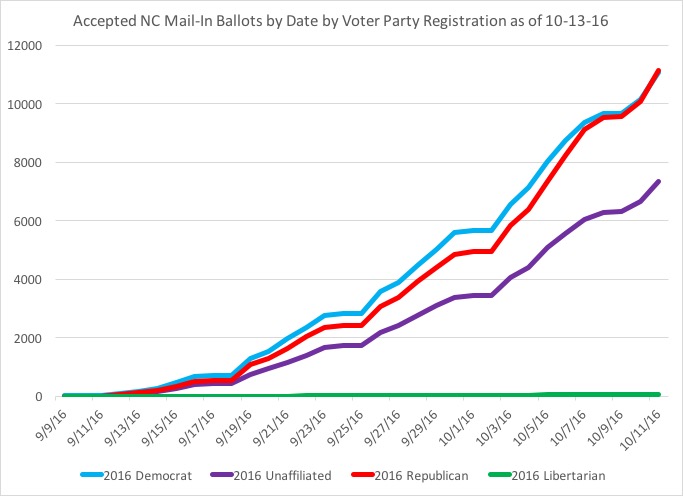
Among the returned and accepted ballots (over 31,400 so far), 38 percent are from registered Republicans, 37 percent from registered Democrats, and 25 percent from registered unaffiliated voters. In comparison to their same-day cumulative accepted ballot totals from 2012:


In comparing these absentee ballots to four years ago:


So far this year, the total accepted ballots is at 77 percent of where they were the same day in 2012, with registered Republicans at 54 percent, registered Democrats at 104 percent, and registered unaffiliated voters at 106 percent.

Of the voters who have requested mail-in ballots, an analysis was conducted as to whether these voters were registered in 2012 and if they participated (and if so, what voting method) that year:


Finally, of the nearly 110,000 ballots still outstanding that have not been returned, the party registration is:


Wednesday, October 12, 2016

GOP Voters Take the Lead in NC Mail-In Requested & Returned Ballots

Registered Republican voters in North Carolina have taken the lead in both requested and returned & accepted mail-in ballots, something that they have historically done but it has been later than in 2012's mail-in balloting.

Of the nearly 135,000 requested mail in ballots, 40 percent are from registered Republicans, 32 percent from registered Democrats, and 28 percent from registered unaffiliated voters.

Among the 28,799 mail in ballots that have been returned and accepted as votes for the general election, registered Republicans are 38 percent, registered Democrats are 37 percent, and registered unaffiliated voters are 25 percent.


While registered Republicans have taken the lead in mail-in balloting, their same-day numbers compared to four years ago are still significantly below in terms of accepted ballots. On this same day in 2012, over 35,000 mail-in ballots had been returned and accepted. Currently, registered Republicans are at 57 percent of their same-day totals from 2012, with registered Democrats at 109 percent and registered unaffiliated voters at 110 percent of their same day totals from four years ago.


Comparing ballots that had been requested and sent out by county boards of elections, registered Republicans are below their same day numbers from four years ago, while both registered Democrats and unaffiliated voters are ahead of their numbers.


Of the 105,000 plus ballots still outstanding so far, registered Republicans are 41 percent, to 30 percent for registered Democrats and 29 percent registered unaffiliated.


Finally, some analysis of how these 2016 mail-in ballot voters participated (if they did) in 2012's election:

Sunday, September 25, 2016

Analysis of Two Full Weeks of NC's Mail-In Ballots

With two full weeks now completed in North Carolina's absentee by mail voting, over 64,500 voters have requested ballots to cast in this year's general election, with 10 percent of ballots (6,534) being returned and accepted for counting come November 8.

Here are the latest figures from Saturday's report (9-24-16) of mail-in absentee ballots requested and returned by party registration, with the various review of them (the most important line is the "ACCEPTED" line) at this point.


So far, requested ballots are 36 percent from registered Democratic voters, 36 percent from registered Republicans, 28 percent from registered unaffiliated voters, and less than 1 percent from registered Libertarians.

Of the returned and accepted ballots, registered Democrats are at an "accepted return rate" of their total ballots of 12 percent, registered Republicans at 10 percent, registered unaffiliated voters at 9 percent, and registered Libertarians at 12 percent.

In looking at the trend lines by party registration of accepted mail-in ballots so far:


As of 9-24-16, registered Democrats are 41 percent of the returned accepted mail-in ballots, registered Republicans are 35 percent, and registered unaffiliated are 24 percent. 

In comparing the same day in 2012 to 2016, the continuation of returned and accepted mail-in ballots from registered Democrats are still bucking the trend from four years ago:


In comparison to the same day four years ago*, the total number of returned accepted ballots is at 153 percent, with registered Democrats at 184 percent, registered unaffiliated at 202 percent, and registered Republicans at 111 percent of where they were the same day in 2012.

Of the outstanding ballots, the party registration is:


I decided to run analysis on three other areas of interest of mine: by generations, by region (meaning, urban vs. suburban vs. rural counties), and native North Carolinians versus those voters born out of state.

In terms of generational cohorts, we would expect older voters (those who are Baby Boomers (born between 1945-64) and those of the Silent & Greatest generations (those born before 1945)) to be the largest users of mail-in absentee balloting, as opposed to Generation Xers (those born between 1965-1980) and Millennials (those born after 1981). And indeed, we see this expectation play out in NC's mail-in absentee ballots, with two-thirds from voters who are either Baby Boomer or those of the Silent/Greatest generations.


To put this into some context, Silent/Greatest generation voters are 12 percent of the overall registration pool, Baby Boomers are 32 percent, Gen Xers are 27 percent, and Millennials are 29 percent (as of 9-24-16).

Regionally, North Carolina is transitioning into a heavy urban state, with 54 percent of registered voters in urban counties, while 20 percent of registered voters are in suburban counties and 26 percent in rural counties (as of 9-24-16). So far, the mail in absentee ballots divided into these county regions are:


Finally, the differences between native NC's and those born outside of NC is pretty striking:


Among all registered voters, native North Carolinians make up 43 percent of the voter pool, but among all requested mail-in ballots so far, non-native voters are two-thirds of the ballots.

*due to 2012's general election being two days ahead of where 2016's general election falls, I made a slight recalculation to account for this discrepancy in this comparison from previous analysis. 

Wednesday, September 21, 2016

Updated NC Absentee Mail-In Ballots as of 9-21-16

As of 9-21-16, nearly 57,000 absentee mail-in ballots had been requested for North Carolina's general election. Out of that number, a little over 3,500 have been returned and accepted as ballots cast, with nearly 53,000 still outstanding and eligible to be returned and reviewed to be accepted as ballots. 
Of the 3,500 accepted ballots, those coming from registered Democrats are still leading (a note/reminder: just because party registration indicates one party does not indicate the likelihood of the individual voting that party, due to the nature of Southern conservative rural Democrats (most likely older voters) being more Republican voters than their own party).


Among the accepted ballots, 41 percent are from registered Democrats, 34 percent from registered Republicans, and 25 percent are from registered unaffiliated voters.

In comparison to 2012's same-day party registration totals (the total is 99 percent of the same day from four-years ago), registered Democrats are at 119 percent of their same-day total from 2012, registered unaffiliated voters are 136 percent from four years ago, and registered Republicans are 70 percent of their total voters from 2012.


Registered Democrats are over-performing their 2012 patterns, both by leading their numbers and continuing to lead in the overall numbers. By this point in 2012, registered Republicans were leading the mail-in absentee balloting and would continue to do so for the remainder of the accepted mail-in balloting.

Among the outstanding ballots remaining, the party registration breakdown is:


Tuesday, September 20, 2016

NC Absentee by Mail-in Ballots as of 9-20-16

With the first full week of absentee by mail-in (early) ballots being cast by North Carolina voters, the start of the second full week has brought the continuation of an interesting trend.

So far, as of 9-20-16, 54,098 mail-in ballots have been requested, with 2,939 ballots returned and accepted as ballots for the general election.


Of the ballots returned and accepted so far:


Compared to the same day four years ago, total ballots accepted are 110 percent, with registered Democrats at 129 percent, registered unaffiliated voters at 142, and registered Republicans at 82 percent of where their numbers were in 2012.


An interesting aspect in comparing this year's numbers against the 2012 trend: at this point, registered Republicans took the lead in mail-in accepted ballots and held that lead up to Election Day. This year, registered Democrats still have the lead, by a little over 200 accepted mail-in ballots.

Updated & reminder: just because 'registered Democrats' seem to be leading does not equate to straight Democratic voters. North Carolina still has an undetermined amount of old-line Southern conservative Democrats who may still be registered with the party, but likely are Republican voters at the ballot box. If I had to hypothesize, then I would say that group is within the Silent/Greatest generation and the older Baby Boomer generation; I would surmise that those Gen Xers and Millennials who register with a party affiliation are truer supporters of that party allegiance, while those who are registering 'unaffiliated' tend to be 'independent but leaners' per national surveys and research on independents. 

Of the over 50,000 outstanding ballots, the division between registered party affiliation is:


Sunday, September 18, 2016

Did NC 2016 Mail-In Ballot Voters Participated in 2012?

As we await the updated numbers from the NC State Board of Elections and the 100 counties about the mail-in absentee ballots requested and received (on Tuesday, due to mail from the weekend and processing the bulk on Monday), some further information on the voters who have requested NC mail-in ballots.

I was curious what this year's voters, who have requested mail-in ballots in 2016, did in 2012: did they vote four years ago, and if they voted, how?

Of the 50,000 plus ballots requested through 9-17-16, I matched the history of these voters of when they registered (pre- or post-2012) and if they voted in 2012, how they voted.


Then, breaking these numbers into percentages, we find the 50,000 voter pool who have requested mail-in ballots with their 2012 activity to be the following:


Finally, I looked at the group who registered after 2012 (28% of the 50K plus mail-in ballot requests as of 9-17) and broke that group by their current party registration:

Of course, we only have a week of mail-in ballot requests and even more importantly, of accepted ballots, so far, but it seems like there is an interest in 'banking one's vote' earlier this year, considering that less than 1/3 of the voters requesting mail-in ballots this year did the same last year. Another such analysis of the second week of mail-in balloting will be useful to see if these trends hold.

Wednesday, September 14, 2016

Absentee Ballots Cast So Far in 2016 Election in North Carolina on 9-14-16 (updated)

Updated*: As of 9-14-16, the absentee mail-in ballots requested and accepted so far are:

*Of the outstanding ballots (42K), the party registration breakdown is:


So far, 338 mail-in ballots have been returned and accepted so far, with the following daily breakdowns of accepted ballots by voters' party registration:


Thursday, August 25, 2016

How Many "Party Switchers" Are There in North Carolina for the 2016 Election?

Based on some entries and Twitter interactions, I've been asked "how many North Carolina registered voters have switched their party registration since the 2012 general election?"

In analyzing the active and inactive North Carolina registered voters as of July 30, 2016 through two data sets from the NC State Board of Elections, I was able to identify those voters who cast ballots in the 2012 general election and are still registered in the state: a total of a little over 4 million voters out of 6.6 million registered voters. The data for this analysis is:


Voted in 2012's General Election as:
Democrat Unaffiliated Republican Libertarian
2016 Party Registration Democrat  1,727,420  17,411  7,361  412
Unaffiliated  51,133  882,859  30,882  1,023
Republican  29,894  13,924  1,306,740  416
Libertarian  512  740  898  8,298
 1,808,959  914,934  1,345,881  10,149

Out of those 4 million voters, 1.8 million voters were registered Democratic voters and cast ballots in 2012's general election. Now, as of July 30, 2016, the breakdown of party registration among those 2012 Democrats is:


Out of the 4 million voters, 1.3 million voters were registered Republican voters who cast ballots in 2012's general election. Now, as of July 30, the party registration breakdown among those 2012 Republicans is:


Finally, nearly 915,000 voters out of the 4 million were registered unaffiliated voters who cast ballots in 2012's general election, and now, as of July 30, their party registration breakdown is:


So, out of the 4 million 7-30-16 active and inactive NC registered voters who cast ballots in 2012's general election, 152,755 voters have switched their party registrations from four years ago to now, equaling 4 percent of the total 4 million.  The most "loyal" registered party group were Republicans, followed by unaffiliated, and then registered Democrats--but all of the groups saw at least 95 percent of their 2012 voters stay with their 2012 party affiliation.