Saturday, October 15, 2016

5 Weeks of NC Absentee by Mail-In Ballots with 150K Ballots Requested

With the end of the fifth week of absentee by mail-in ballots in North Carolina, over 150,000 voters have requested ballots for the November 8, 2016 general election.


Of the requested ballots, 40 percent are from registered Republicans, 31 percent from registered Democrats, and 28 percent from registered unaffiliated voters. To compare these percentages against the 10-15-16 voter registration pool, 40 percent of NC voters are registered Democrats, 30 percent registered Republicans, 30 percent are registered unaffiliated, and less than 1 percent are registered Libertarians.

In comparison to 2012's sent ballots by dates leading up to that year's general election by party registration:


Sent ballots out are running slightly ahead of where they were this same day in 2012 (102 percent as of the same-day 2012 numbers), but registered Democrats are at 118 percent of their same day numbers from 2012, registered unaffiliated voters are 137 percent, registered Libertarians are 178 percent, and registered Republicans are 79 percent of where they were this same day in 2012.

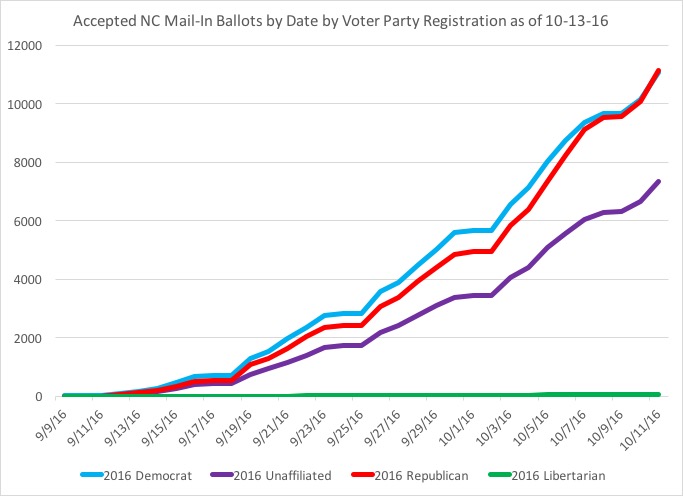
Among the nearly 39,000 ballots that have been returned and accepted as votes for the general election, 39 percent are from registered Republicans, 36 percent are from registered Democrats, 25 percent from registered unaffiliated voters, and less than 1 percent are from registered Libertarians. Over the past five weeks, the pattern of returned and accepted ballots is:


The return rate so far for registered Republicans is 24 percent, registered Democrats is 29 percent, registered unaffiliated voters is 23 percent, and registered Libertarians is 19 percent.

In comparing the returned and accepted ballots to four years ago by party registration:


As of today, this year's returned and accepted mail-in ballots are current 78 percent of where the same-day totals were in 2012. Registered Republicans are at 56 percent of their 2012 same-day numbers, while registered Democrats are 103 percent and registered unaffiliated voters are 107 percent of their same-day totals from four years ago.

Among the outstanding ballots that have yet to be returned and confirmed/accepted, by party registration:


In looking at the racial composition of the requested mail-in ballots so far:


Finally, in looking at whether the 2016 mail-in ballot voters were registered in 2012, and if so, how they voted, or whether they registered after the 2012 election:


Friday, October 14, 2016

Nearing the End of the 5th Week of NC Absentee Mail-In Ballots

As North Carolina nears the end of its fifth week of absentee mail-in ballots, over 147,000 ballots have been requested, with 34,000 of them returned and accepted as votes for the November 8th election.

Of the requested ballots, 40 percent of them are from registered Republicans, with 31 percent from registered Democrats, 28 percent from registered unaffiliated voters, and less than one percent from registered Libertarians.

In terms of the ballots sent out by party registration and in comparison to their levels from four years ago, registered Republicans are running significantly behind their same-day numbers, while Democrats and unaffiliated voters are running ahead of the same-day totals from 2012.


Among the accepted ballots counted, 38 percent are from registered Republicans, 37 percent from registered Democrats, and 25 percent from registered unaffiliated voters. 


A difference of 474 ballots separate registered Republicans from Democrats, in a voting method that is traditionally dominated by Republicans. 

In comparison to four years ago on this same day, this year's accepted mail-in ballots are running behind the totals: of the over 34,000 ballots submitted this year, four years ago the same number was over 46,600. 

Registered Republicans are underperforming their 2012 same-day totals; they are only 52 percent of where they were four years ago. Registered Democrats and unaffiliated voters are at the same numbers of their total same-day cumulative accepted ballots. 


Of the outstanding ballots remaining, the party registration breakdown is:


In looking at the voters who have requested mail-in ballots so far, their level of participation and registration from four years ago shows less than a third are using the same voting method that they did from four years ago, while 38 percent of this year's mail-in ballot voters voted in person (either early or on Election Day). 


In looking at the racial breakdowns of 2016's mail-in ballot voters so far:

Of the requested ballots, 84 percent are from white voters and 8 percent from black voters; traditionally, white voters dominate in the mail-in ballots method, while black voters will show up in person during early voting, which starts on October 20. 

Of the voters who are native North Carolinians versus those born out of state (or unknown birth state), 36 percent are natives, with 64 percent born out of state or unknown. Among the party registrations for native vs. non-native voters who have requested absentee by mail-in ballots so far:


Finally, some analysis based on 'region' of North Carolina: urban vs. suburban vs. rural voters and their party registration for requesting mail-in absentee ballots:


Urban voters are 60 percent of the requested mail-in ballots, with 19 percent from suburban voters and 21 percent from rural county voters. 

Thursday, October 13, 2016

Updated Numbers of NC's Absentee by Mail-In Ballots as of 10-13-16

So far, over 141,000 mail-in absentee ballots have been requested by North Carolina voters, with 40 percent of the requests coming from registered Republicans, 32 percent from registered Democrats, 28 percent from registered unaffiliated voters, and less than one percent from registered Libertarians.


Among those who have requested mail-in ballots and comparing them to four years ago (same day totals of ballots sent out by county board of elections):


Among the returned and accepted ballots (over 31,400 so far), 38 percent are from registered Republicans, 37 percent from registered Democrats, and 25 percent from registered unaffiliated voters. In comparison to their same-day cumulative accepted ballot totals from 2012:


In comparing these absentee ballots to four years ago:


So far this year, the total accepted ballots is at 77 percent of where they were the same day in 2012, with registered Republicans at 54 percent, registered Democrats at 104 percent, and registered unaffiliated voters at 106 percent.

Of the voters who have requested mail-in ballots, an analysis was conducted as to whether these voters were registered in 2012 and if they participated (and if so, what voting method) that year:


Finally, of the nearly 110,000 ballots still outstanding that have not been returned, the party registration is:


Wednesday, October 12, 2016

GOP Voters Take the Lead in NC Mail-In Requested & Returned Ballots

Registered Republican voters in North Carolina have taken the lead in both requested and returned & accepted mail-in ballots, something that they have historically done but it has been later than in 2012's mail-in balloting.

Of the nearly 135,000 requested mail in ballots, 40 percent are from registered Republicans, 32 percent from registered Democrats, and 28 percent from registered unaffiliated voters.

Among the 28,799 mail in ballots that have been returned and accepted as votes for the general election, registered Republicans are 38 percent, registered Democrats are 37 percent, and registered unaffiliated voters are 25 percent.


While registered Republicans have taken the lead in mail-in balloting, their same-day numbers compared to four years ago are still significantly below in terms of accepted ballots. On this same day in 2012, over 35,000 mail-in ballots had been returned and accepted. Currently, registered Republicans are at 57 percent of their same-day totals from 2012, with registered Democrats at 109 percent and registered unaffiliated voters at 110 percent of their same day totals from four years ago.


Comparing ballots that had been requested and sent out by county boards of elections, registered Republicans are below their same day numbers from four years ago, while both registered Democrats and unaffiliated voters are ahead of their numbers.


Of the 105,000 plus ballots still outstanding so far, registered Republicans are 41 percent, to 30 percent for registered Democrats and 29 percent registered unaffiliated.


Finally, some analysis of how these 2016 mail-in ballot voters participated (if they did) in 2012's election:

Monday, October 10, 2016

Awaiting the 5th Week of NC's Absentee Mail-In Ballots

As we await the fifth week of North Carolina's absentee by mail-in ballots to recommence following the Columbus Day holiday, the final numbers of the first four weeks continue to demonstrate that registered Republican voters, while taking the lead in requested ballots, are significantly behind their numbers from 2012 on the same day. Conversely, both registered Democrats and registered unaffiliated voters are showing a greater-than-four-years-ago presence in a traditionally GOP-heavy voting method.

So far, nearly 125,000 North Carolina registered voters have requested mail-in ballots, with nearly 25,000 returning their ballots and having them reviewed and accepted.


Among the requested ballots:


  • White voters: 84.4 percent
  • Black voters: 8.7 percent
  • Millennials: 21.5 percent
  • Generation X: 13.1 percent
  • Baby Boomers: 35.2 percent
  • Silent/Greatest: 30.1 percent
  • Native North Carolinians (born in the state): 35.3 percent
  • Born outside of the state/unknown: 64.7 percent


Among the requested ballots, registered Republican voters are 40 percent, with 32 percent from registered Democrats, 28 percent from registered unaffiliated voters, and less than one percent from registered Libertarians.

Among the accepted ballots, 38 percent are from registered Democrats, 37 percent from registered Republicans, and 25 percent from registered unaffiliated voters.


In comparing the same day totals, by party registration, against the same day cumulative totals in 2012:


While the total number of accepted ballots returned so far in comparison to 2012 are behind (only 83 percent of where they were four years ago), registered Democrats and unaffiliated voters are at 112 percent of their 2012 same-day totals each, while registered Republicans are only 58 percent of where they were in 2012 on the same day totals.

In looking at the total ballots requested (sent out on same day in 2012 and 2016), again, both registered Democrats and unaffiliated voters are ahead of their same day totals from 2012, while registered Republicans are significantly behind in their requested/sent ballots.


Of the outstanding ballots by party registration:


Finally, some analysis on how (and if) the 2016 mail-in voters participated in 2012 or were registered after 2012: