So far, North Carolina has over 658,000 requests for ballots, with the overwhelming number of them in the form of absentee onestop (in other words, in-person early votes). Over 585,000 of these requested ballots have been returned and accepted as votes for November 6's election.
A comparison to 2010, 2014, and 2016 shows that 2018 is on a different trend line from past mid-terms, and is mirroring the numbers posted in the last presidential election.

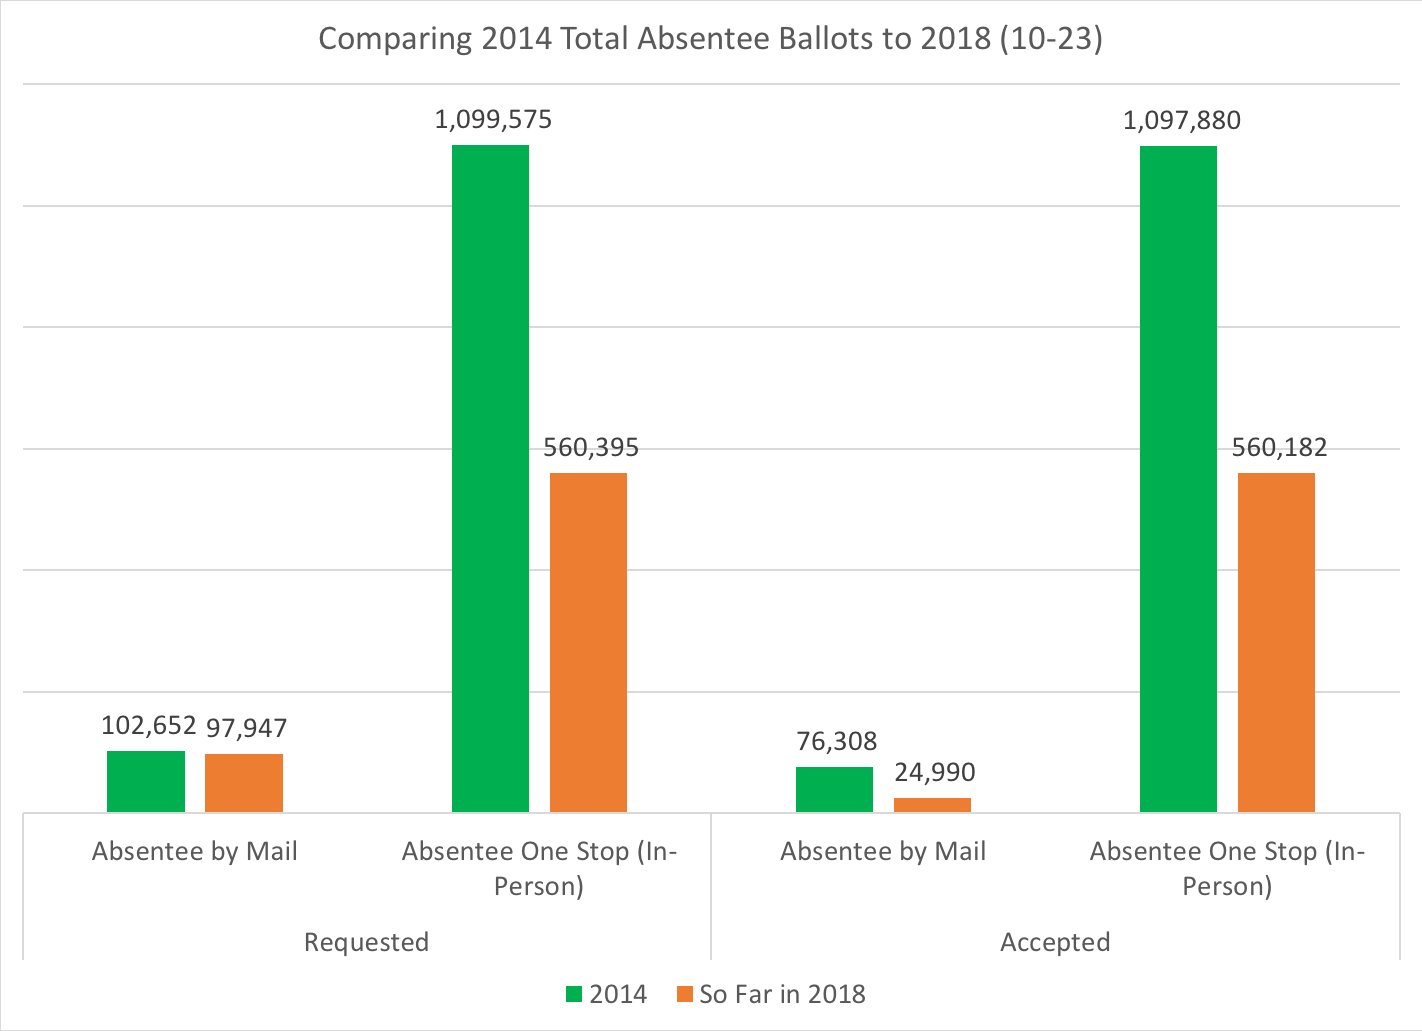
Here are the specific numbers from the NC State Board of Elections, where this data comes from, first by requested ballots:

Then, by ballots that have been returned and accepted:

- 95% of 2014's final numbers for absentee by mail requests
- 33% of 2014's final numbers for absentee by mail accepted
- 51% of 2014's final numbers for absentee onestop/in-person requested and accepted
So far, 2018's absentee in-person ballots that have been accepted breakdown by voter party registration:

And the daily trend lines for voter party registration over the past week has been, first for raw numbers:

And by party percentages:

By generational cohorts, defined by the Pew Research Center, shows that for all the talk about young voter enthusiasm, it hasn't shown up in North Carolina's early voting numbers yet:

And in comparison to the 7M plus registered voter pool of the state, older voters are significantly overperforming their voter percentage rates:

The average voter age so far is 60 years old.
As a reminder: North Carolina has a "blue-moon" election cycle, with no major statewide race at the top of the ballot, other than a state supreme court election and a vote on six constitutional amendments. So, all of the focus early on has been at the congressional level:


In looking at how NC early voters participated (or didn't) in 2014's mid-term, nearly half of this year's voters used the same method to cast their ballots in 2014:

And in looking at the voter's party registration for these different methods of casting ballots so far:

And by percentages of voter party registration within each vote method:

Probably most interesting is looking at within the voter party registrations for Democrats, Republicans, and unaffiliated voters and seeing how each group used different vote methods (or didn't) in 2014 as they are voting this year:

Slightly more Republicans (23%) voted on Election Day in 2014 than have Democrats (20%) and unaffiliated (20%) voters.
By gender, the divide between women and men is showing an interesting party registration divide, as to be expected:

Nearly half of women voters who have cast absentee in-person ballots so far are registered Democrats.
For comparison, here are the 10-20-18 voter registration pool percentages based on gender:

And then looking at 'regionalism' (urban city voter; suburban voter within an urban county; surrounding suburban county voter; and rural county voter) by gender and then voter party registration:


White voters are nearly three-fourths of early voters so far, with black/African-American voters at 20 percent of the ballots accepted so far:

For comparison, here are the percentages of party registration by race for 10-20-18's voter registration pool of the state:

And here are the daily total numbers so far, by voter race:

And by percentage of voter race:

Finally, I took the voter history data of voters who cast ballots in the general elections going back to 2008, and devised a category system for "high-propensity" voters who cast ballots in all general elections from 2008 to 2016, and then "presidential" voters who cast ballots in 2008-2016's presidential election but not in 2010 or 2014 mid-term election years, and then merged that data with the early voters so far.
First, the high propensity and presidential-only voters in the requested voter ballot data, both by numbers and then by percentage of the voter's party registration group:


And then by the accepted ballots, both numbers and percentage for high-propensity and presidential-only voters:


While 58 percent of the early voters in North Carolina are either 'high propensity' or 'presidential only' voters, 62 percent of registered Republicans and 61 percent of registered Democrats fit into these categories. One question that is on the mind of a lot of folks: are early voters more likely to be voters who would vote anyway, or perhaps vote on Election Day? This seems to indicate, at least so far, that early partisan voters are likely voters and that they tend to be regulars at the polls.
Again, I'll be posting this data each day through early voting at my Twitter accounts, @oldnorthstpol and @BowTiePolitics, if you want a daily tracking of these charts and information.