By Michael Bitzer
With North Carolina's counties and state board of elections finalizing the results of the 2022 mid-term elections, and the subsequent completion of voter history data on the 3.7 million North Carolinians who cast a ballot this past November, we can now get an official portrait of the state's electorate and who showed up.
And based on this information, a reevaluation of the performance of one political party in 2022 is warranted. More on that later.
As a reminder: the voter history data file compiles each voter's casting of a ballot for an election, along with the party they were registered with and the method that the voter utilized to cast a ballot. Once you combine this data with the voter registration data file (I used the December 3, 2022 voter registration file), you can merge the voter history information with the registration data and analyze the electorate based on official records.
This post will focus on the turnout rates for various voter demographics, along with comparing the electorates to the voter pool; future posts will analyze other dynamics that the data tells us, especially for past voting trends and vote methods.
Turnout by Party Registration
Over the past two decades, North Carolina has seen distinctive trends when it comes to turnout rates by party registration: registered Republicans have the highest turnout rates, with registered Democrats typically at the state turnout rate and registered Unaffiliateds lagging behind.
In 2022's mid-term election, this pattern held yet again, one that has been consistent since 2010: registered Republicans saw a 58.4 percent turnout, while registered Democrats were at 51.2, and registered Unaffiliateds were at 44.7 percent.

This consistent pattern has held since the 2010 Republican wave election, as evident in this chart:

Only in 2006 and 2008--which were national Democratic years--did registered Democrats meet the turnout rate of Republicans. But since 2010, the continuous spike of Republican turnout has been the dominant theme of North Carolina electoral politics.
To give a broader sense, the following chart compares the electorate (those who cast ballots) versus the voter pool, and how the compositions differed from one another.

In 2022, registered Republicans were the highest percentage of the electorate (34.4 percent), followed closely behind by registered Democrats, with Unaffiliateds behind at 31 percent.
Much has been made in North Carolina politics about the take-over of the voter pool by registered Unaffiliateds, but when it comes to who actually shows up to cast ballots, this largest group of registered voters take a consistent back-seat to the partisans.
Turnout by Race & Ethnicity
While the overall voter registration pool continues to diversify, the electorate is a different subject altogether, and the 2022 mid-term election demonstrated a continuing over-performance by White non-Hispanic voters, despite the historic candidacy for the Democrats of an African-American woman at the top of the ballot.
The turnout rates for the major racial-ethnic groups showed that Whites had the highest rate, while Black/African Americans were significant below the state's average.

For Black/African Americans, their turnout rate was nearly ten points below the state's turnout rate, while White turnout was 7 points ahead. Hispanic/Latino voters continue their extremely low turnout trend: in 2020, when North Carolina had a 75 percent turnout rate, only 59 percent of the Hispanic/Latino registered voters showed up that year.
Comparing the electorate versus the voter pool, the stark difference in what the two pools is on display:
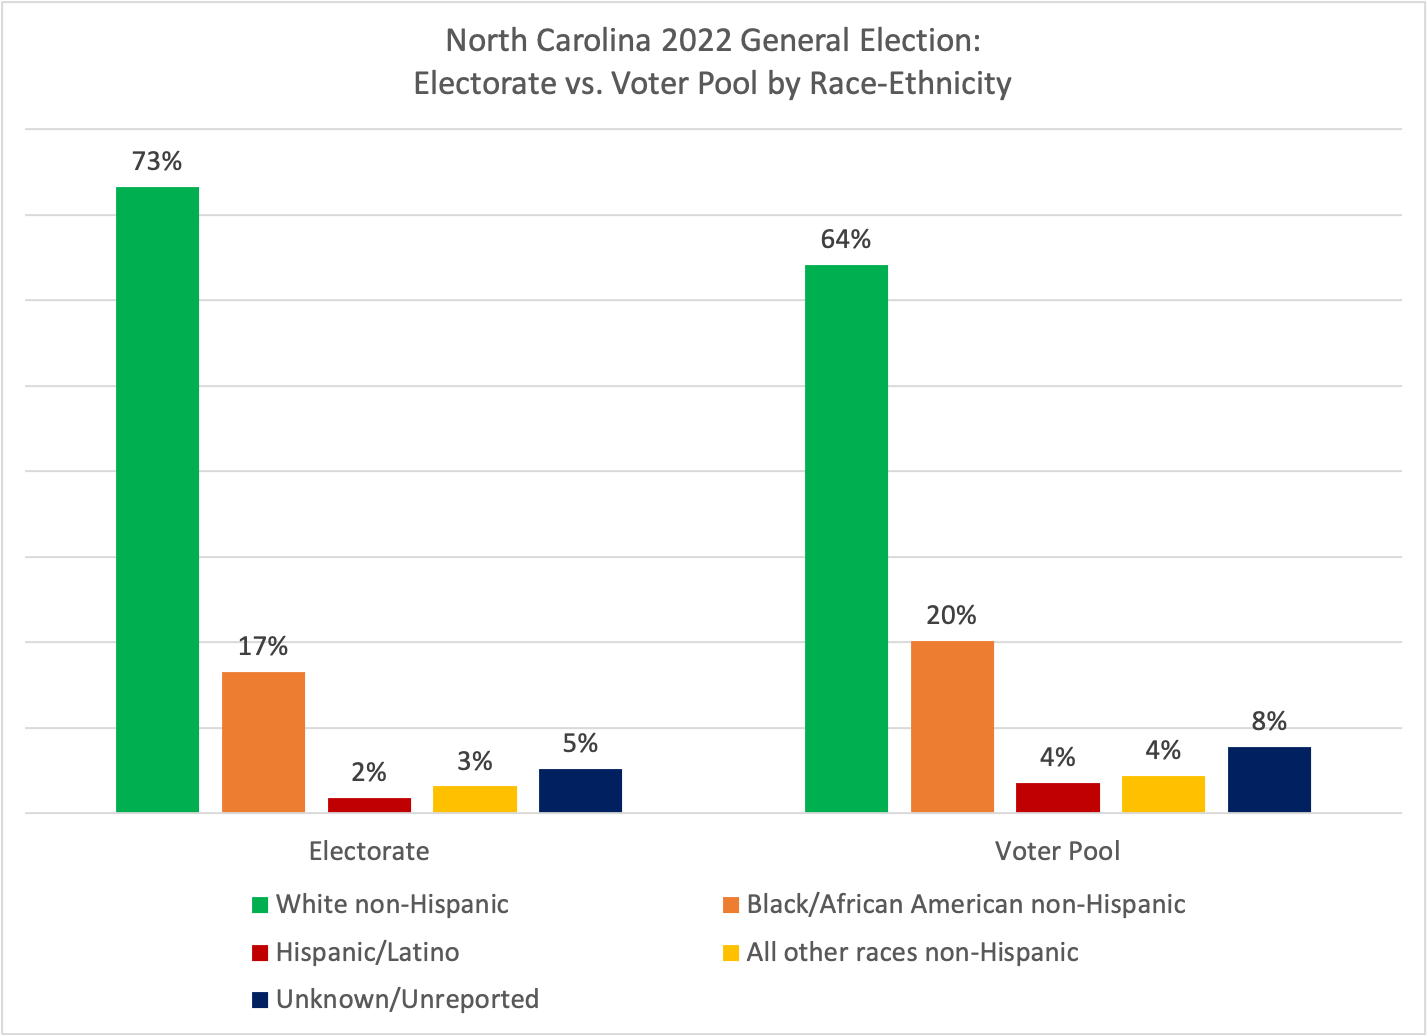
For Democrats to be successful on a state-wide basis, Black/African American voters need to match their voter pool percentage within the electorate, but in 2022, they were 3 points below. White non-Hispanic voters were nearly 10 percentage points above their voter pool in the electorate.
Turnout by Generation
As with the rest of the nation, North Carolina's politics continues to see a generational transformation underway. But unlike the nation in 2022, North Carolina's 'young voters' didn't match older voters in their participation in this year's election.
First, the turnout rates for voters under 41 years old--Millennials and Generation Z--were abysmally below the state's turnout rate.

Less than one-quarter of Generation Z and a little over a third of Millennials cast ballots this year. Conversely, 7 out of 10 Boomers and two-thirds of the Silent Generation showed up to cast ballots. The "bridge" generation between younger and older voters, that of Generation X, had a slightly higher turnout rate than the state-wide rate of 55 percent.
While the average age of North Carolina's registered voter pool is 48 years old, the electorate subsequently skewed much older, at 55 years old.
With nearly 40 percent of North Carolina registered voters under the age of 41, less than a quarter of the votes cast came from that same group in 2022.

This disparity within which generation shows up has real consequences to voting patterns and behavior. Based on the 2020 election, as the percentage of Boomers increased in a precinct, so did the precinct's Republican Big 3 vote percentage (the positive slope to the blue line in this scatterplot).
 |
| Big 3 Elections = US President, US Senate, and NC Governor |
But in the same election, taking the same dynamic with Millennials (meaning, examining what happens when you increase the percentage of Millennials voting in a precinct as to the relationship with the Republican vote in the precinct), you see a very different line and slope associated with it.
 |
| Big 3 Election = US President, US Senate, and NC Governor |
The slope of the line is downward, meaning that as the percentage of Millennials casting a vote in a precinct increased, the percentage of the Republican Big 3 vote decreased. This is the effect of generational politics and voting behavior in turnout dynamics.
Turnout by NC's 'Regions'
Finally, the urban-suburban-rural dynamic that has been evident in North Carolina's electoral politics was once again showing a real difference within these regions.

Central city voters were four percentage points behind the state turnout rate, while the urban suburbs (those areas outside the central cities but inside the urban counties) were three points ahead, with surrounding suburban and rural counties slightly ahead or at the state turnout rate.
And when it comes to comparing the voter pool to the electorate, the over-performance of the suburbs showing up in the electorate versus the voter pool is very evident.

As a reminder when it comes to regionalism: North Carolina's central cities are Democratic dominated, but the competitive urban suburbs and Republican-dominated surrounding suburban counties and rural counties wash out the Democratic city vote to create the competitive nature of the state-wide dynamics.
 |
| Big 3 Elections = US Presidential, US Senate, and NC Governor. |
More analysis will need to be done by splitting the central city votes from the urban suburb votes, but a preliminary look at urban counties versus suburban and rural counties in the 2022 US Senate elections shows a real electoral disparity when it comes to the two-party vote in the three areas.

In The 'Initial' Final Assessment of 2022's Election
In the coming weeks, I'm sure my colleagues and I will have more assessments of the 2022 general election and what it means for the state's politics as we drive towards 2024, but what this first post of the 'big picture' dynamics presents is that taking all of these turnout factors into account--a Whiter, older, more-Republican, and more-suburban electorate--there are some important lessons for both political parties.
For Republicans, it's simple: keep doing what you do. In the short-run, higher turnout rates for key GOP groups will continue to see you win the "competitive but stuck" battleground electoral environment, at least state-wide.
For Democrats, it's also simple: if you want to keep your federal candidates getting 48 to 49 percent of the vote, but lose to Republicans by the narrowest of margins time after time, keep doing what you are doing. Keep getting your registered partisans to show up just at the state-level, but allow your partisan opponents to show up at a higher rate. Ignore turning out voters under 40 years old, ignore turning out core Black/African American voters, and ignore your regional dominance in the central cities.
In the end, it wasn't that Democrats like Cheri Beasley did as well as she did in what was presented as a classic mid-term environment, but rather she did as well despite the fact that core Democratic voting blocks had abysmal turnout rates.
And it may seem like we say this every election cycle, but in North Carolina, it's true: it's all about who shows up and turns out. Once again, 2022 repeats the consistency of North Carolina's electoral politics as a 'stuck battleground' state, and in the end, turnout matters.
--------------------
Dr. Michael Bitzer is a professor of politics and history at Catawba College where he holds the Leonard Chair of Political Science. He tweets at @BowTiePolitics, and is on Mastodon at @BowTiePolitics@sciences.social and on Post at @BowTiePolitics.