By Michael Bitzer
Since the dust has seemingly settled on 2022, and already we're turning attention to 2024 (yes, I know, I know), the hot takes of what the 2022 mid-term elections are flying fast and furious before we shift our gaze to the next election cycle.
Needless to say, there's a LOT to digest and understand about what this historic election means in the context of what we know about mid-term elections in our politics. My fellow contributors and I have been bouncing ideas back and forth between each other, but the one thing (or more appropriately, the one 'model') that we political scientists tend to rely on for explaining mid-term election is the connection between a president's approval rating and the ultimate number of seats in Congress gained, or more likely, lost.
In a couple of public presentations made over the election cycle, here's a chart of the president's approval ratings (on the horizontal, or X axis) compared to the number of congressional seats gained or lost (on the vertical, or Y axis):
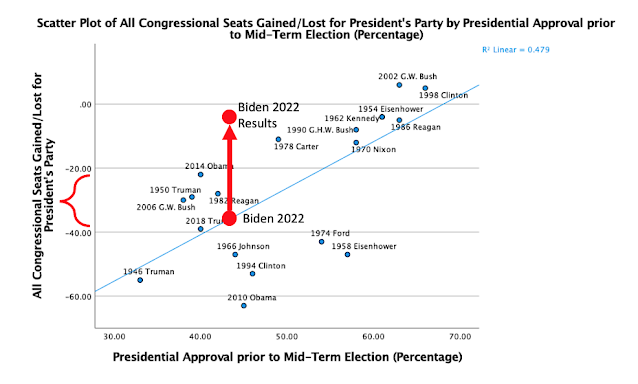
Notice that with Biden's approval sitting around 43 to 44 percent, it was estimated (the blue line) that he would be in range of 2018 Trump, 1982 Reagan, 2014 Obama, and 2006 G.W. Bush of 20 to 40 seats lost.
Where Biden ended up is well outside that 20-40 loss range, to the point of being around 10 seats ultimately lost (with having gained a U.S. Senate seat, at this point). Biden, it seems, is in a category all on his own, otherwise known as an "outlier" to the others.
But I digress: all of this is to say that we need to explore and understand this year's dynamics a bit better to see where it fits into many other 'models' that help political scientists understand and explain the political world out there.
One other source of controversy in Election 2022's 'hot takes' is the Old North State's political character. Following their wins by adding to their majorities (especially a super-majority in the state senate and one seat away from supermajority in the state house), Republican legislative leaders talked about overall political dynamic of the state and its political characterization, especially by the speaker of the North Carolina House of Representatives, Tim Moore. Here's his relevant comments (courtesy of Spectrum News 1) from that press conference with state senate president pro temp Phil Berger:
Now, the speaker is at liberty to explain his analysis of the state's politics, but in data-terms, the congressional map played itself out as most political estimates tended to portray: as Whitney Ross Manzo and I described in this post, using the 2020 election results for U.S. president, U.S. Senate, and N.C. governor within each district gave us a general picture how the 'baseline' dynamics at play. And here, visually, is that baseline analysis:
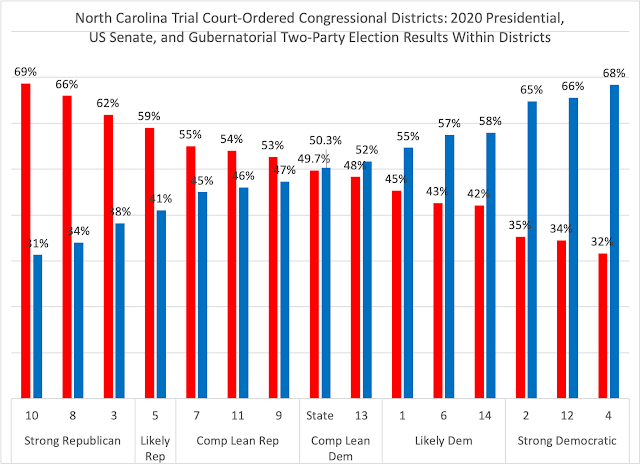 |
| Data Compiled by Michael Bitzer |
When analyzing the 2022 unofficial results (pending certification) within each district, we find a pretty good relationship between what 2020's "Big 3" Republican percentages and what the 2022 Republican results were:
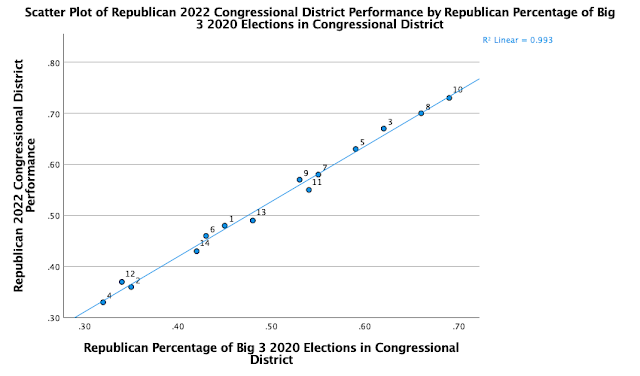 |
| Republican Percentages Compiled by NC Board of Elections Data by Michael Bitzer |
Now, this isn't to say that there aren't other factors at play, but if you want to hit the Las Vegas strip with gambling odds of 99 percent, let me know and we'll book a trip.
Beyond just gambling, what this seems to indicate to me is that North Carolina's political behavior is "stuck": two years can pass and the political behavior of an area of the state is strongly related to what happened in the past.
This is another model of what political scientists rely on to help understand and explain the world, namely that partisanship and its corresponding loyalty is pretty profound when it comes to voters and the political parties having sorted themselves and being tribalistic in their voting habits.
Returning to Speaker Moore's "NC ain't 7-7 but I don't know what it is" characterization, it's all about: 1., how you define the parameters of what is 'political competitiveness' and 2., how you measure that level of competitiveness.
For most of us studying politics and especially voting behavior and results, we tend to measure competitiveness in a three-tier categorization: 46-54 percent is competitive (over 50 'leans' to one party over the other); 55-59 percent is 'likely' for that party; and 60 percent or higher is 'strong' for that party.
So, anything that falls between 50 and 54 percent, with just slight movements of voters (turnout, candidate quality, etc.), that area/district/state could conceivably 'flip' from one party to the other. If you are looking at an area that is more than 60 percent for one party, the level of tsunami would have been extraordinary to flip that area.
With that measurement and categories, here's the 2022 election results and the respective two-party vote percentages and actual votes for a variety of state-wide (US House results combined) and the state totals:
 |
| 2022 Two-Party Election Night Results based on NC State Board of Elections Data, compiled by Michael Bitzer |
As noted, for seven different state-wide contests, and all 14 US House districts combined, the state resulted in a 52.6 to 47.4 percent Republican to Democratic result.
Of the official state-wide races in 2022, only one, the Court of Appeals Seat 09 election, was 54 percent in its two-party vote. All the others, including the U.S. Senate contest, fell into a 52-48 bandwidth.
That, by the above definition and category, is competitive. You can argue with the characterization (maybe true competitiveness has to be 50-50 dead even), but most folks could accept the premise that a 52-48 result is still competitive.
So What Is North Carolina, Politically?
Granted, all of this (relatively speaking) is a rather new phenomenon for North Carolina's politics if you look historically at the state's politics.
I recently posted a Twitter thread on the state's political environment since the end of Reconstruction in the state, and wanted to share it here (just in case rumors of Twitter's demise are correct).
In contemplating today's political nature of North Carolina, it's helpful to have a retrospective and historical basis to compare against. North Carolina wasn't always a competitive state, but rather a unique set of political 'eras' that followed general patterns and was influenced by outside dynamics in the nation as a whole.
Again, I want to start with some simple definitions of what I'm talking about when it comes to these political eras in the state:
1868-1896: competitive post-Civil War era
1900-1944: Jim Crow era & Solid Democratic South
1948-1964: Beginnings of Democratic South collapse
1968-1980: Southern Republican realignment underway
1984-2004: Republican South but a BiPolar Partisan North Carolina
2008-2022: North Carolina's new competitive era
The competitive post-Civil War era in North Carolina is uniquely defined by a two-party North Carolina, along with the rise of a third party that combined with Republicans to create the Fusionist era of the state's party. It was overthrown by the white supremacy and racist campaigns of the late 1890s Democratic Party into the early 1900s, which introduced the segregated era across the South and the resulting Solid Democratic South.
Unlike other southern U.S. states, North Carolina always had a rump of Republicanism willing to challenge the majority Democratic Party during this time period. But with the advent of the New Deal Democratic coalition, and the decrease in power of the conservative and segregationist Southern Democrats within their own party, fissures began to erupt and came to a head with the 1948 Dixiecrat rebellion within the nation's majority party.
This fissure began the significant crack in Southern politics that came to a head in 1964's presidential campaign, with Barry Goldwater's conservative take-over of the Republican Party and his 'hunting' for conservative Southern ducks. Richard Nixon's 1968 Southern strategy built on Goldwater's hunt for conservatives, and built on the region's realigning process, and North Carolina, to turn the Solid Democratic South into a majority Republican region.
With Ronald Reagan's capture and creation of a truly conservative Republican Party, the twenty-year period of 1984-2004 represented a unique dynamic in North Carolina, as compared to other southern states. North Carolinians had a bi-polar political character: intensely red at the federal level (U.S. president and Senate elections, in general), while maintaining a blue hue in state-level contests, notably for governor. Yes, the opposition could lay claim to each within the bi-polar nature, but the best representation was in 2004's election: Republican George W. Bush won the state by 13 percentage points, but on the same ballot, Democrat Mike Easley won the governorship by 13 percentage points. North Carolina's voters were perfectly happy to split their ballots with wide swings.
But with 2008's Barack Obama ground game operation and the nation turning into a highly-polarized and sorted environment, North Carolina has come to reflect those national dynamics at play. And since 2008 and 2010's mid-terms, political sorting and loyalty represent the state's political character.
Each era, using in general federal election years as the demarcation, have unique tendencies and patterns in North Carolina's electoral habits. At the federal level of U.S. presidential and senatorial contests, here's the general pattern of political behavior for the state over the six eras, first for all votes, then for two-party vote patterns:


In terms of votes for U.S. President and Senators in North Carolina, the competitive 1868-1896 era gave way to the Democratic dominance of the 1900-1944, with a slight drop in the 1948-1966 realigning era and a highly competitive 1968-1980 era. North Carolina moved much more to the red in 1984-2004, but settled back into comparable, but opposite, era when compared to the first era.
Among the Council of State elections, for the data we have, we see a similar pattern up to the 1968-1980 era as we did in the federal elections, but then a sense of Democrats being able to hold their own at this level against the Republican tendencies in 1984-2004 and in the current era.
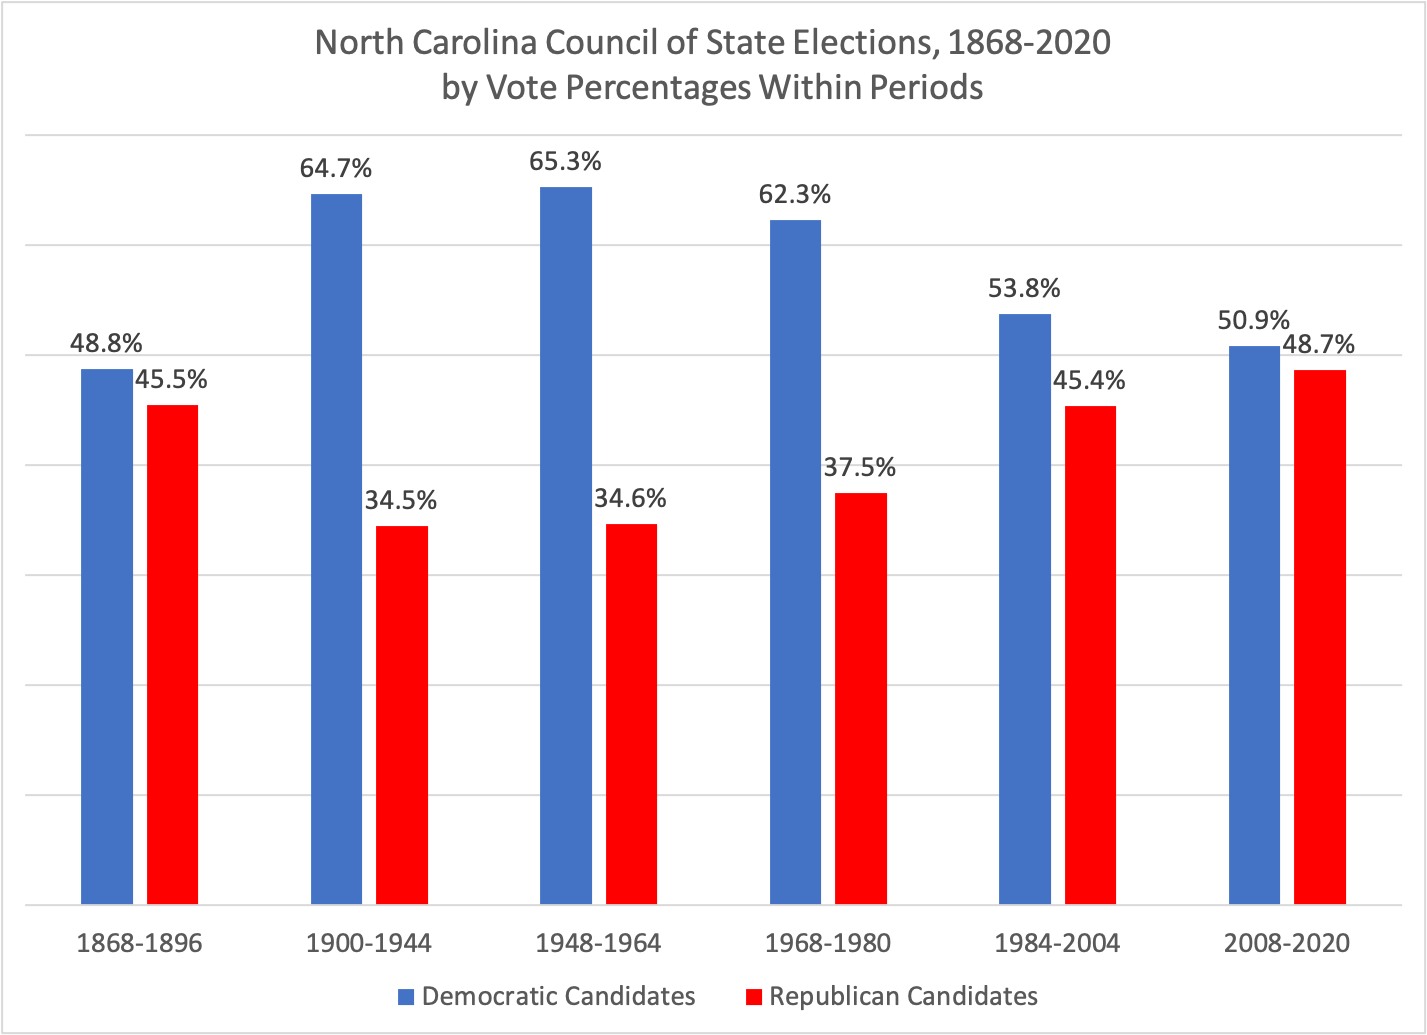

For ease of comparison, this next bar chart gives the two most recent political eras: the two-decade Reagan era of 1984-2004, with the current political era of both Federal and State elections. In the Federal and State elections, you see how one party tended to be more 'favored' in the 1984-2004 era, while each party then became "ever so slightly favored" in the 2008-2022 current era.

And if you look just since 2008 for both Federal and State contests, you see how North Carolina can be competitive with a slight red-tint at the Federal and a slight blue-hue at the State level.

And What Do 2022's Election Trends Add to NC's Political Dynamics?
Along with this competitiveness, North Carolina's political dynamics point to one that is fitting into a new analysis of U.S. politics, that of a calcified political environment described and analyzed in the newest addition to their series of presidential elections, "The Bitter End: The 2020 Presidential Campaign and the Challenge to American Democracy," by political scientists John Sides, Chris Tausanovitch, and Lynn Vavreck.
Their view of the American electorate having become calcified is based on:
"As it does in the body, calcification produces hardening and rigidity: people are more firmly in place and harder to move away from their predispositions. Growing calcification is a logical consequence of growing polarization, but the concepts are not identical. Polarization means more distance between voters in opposing parties in terms of their values, ideas, and views on policy.
Calcification means less willingness to defect from their party, such as by breaking with their party's president or even voting for the opposite party. There is thus less chance for new and even dramatic events to change people's choices at the ballot box. New events tend to be absorbed into an axis of conflict in which identity plays the central role. And this means smaller fluctuations from year to year in election outcomes." (page 6, emphasis added)
In 2022's North Carolina elections, this rigidity seems abundantly clear. Using the same principles as the scatterplots above, looking at US Senate Republican candidate Ted Budd's performance in each of the 100 counties against the Republican percentage of 2020's Big 3 Election Results, it's a 98 percent relationship between the two:

Going down the ballot, here's the 2020 Big 3 Two-Party Republican Vote within North Carolina's state senate districts and how the Republican candidates for state senate performance--another 97 percent relationship:

And the same for NC's state house, with another 98 percent relationship.

In fact, for North Carolina's two state supreme court contests, the 2020 Big 3 give at least a 97 percent explanation of the vote in the 100 counties across the state.

 |
| Data from NC State Board of Elections and compiled by Michael Bitzer |
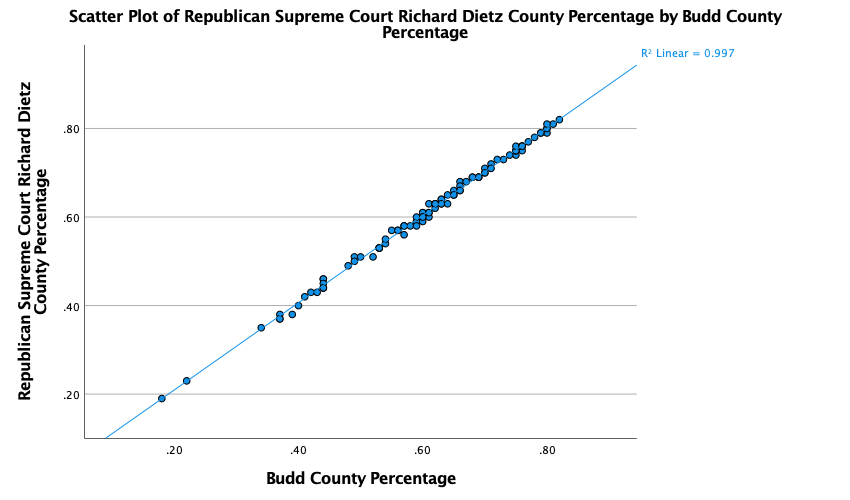
This makes North Carolina, at least in 2022, a state of straight-ticket voting: voters picking one party at the top of the ballot and sticking with that party down the ballot. In fact, if you use the "top contest" of the U.S. Senate contests and compared the NC State Supreme Court contests, you'll find Budd's percentage in a county explains both Republican supreme court candidates' county percentage at 99 percent.

 |
| Data from NC State Board of Elections and compiled by Michael Bitzer |
Granted, most voters may not know or understand the candidates for the state's highest court, and therefore resort to party labels as 'cues' to signal which side of the ballot to fall on. But the relationship is so strong that partisanship seems to make this state's electorate rigid.
With the on-going competitiveness of elections (compilation of results) of what North Carolina voters are living in right now, the pattern of data tells me, at least, that the Old North State is a continued bifurcated state, literally on the knife's edge of tipping to one party or the other, depending on the type of election you are focused on, and also a state that appears very rigid and calcified in its voting patterns.
And while others may not know what North Carolina's political character is, or aren't willing to articulate their perspective, this data speaks for itself.
--------------------
Dr. Michael Bitzer holds the Leonard Chair of Political Science at Catawba College, where he is a professor of politics and history. He just joined Mastodon at https://sciences.social/@BowTiePolitics and tweets (while the site lasts) at https://twitter.com/BowTiePolitics