by Michael Bitzer and Christopher Cooper
Last week, the number of registered Unaffiliated voters passed the number of Democratic voters to make Unaffiliated the largest group of registered voters in NC politics. This is a topic that we've written about recently as have some of the state's best journalists. Given the importance of last week's partisan eclipse, we thought it would be a good time to take an overview of what the data tell us about Unaffiliated voters in North Carolina.
Overview
As you can see from the graph below, the rise of Unaffiliated voters has been a long build that has only recently come to fruition. Unaffiliated voters hovered around 5 percent of the North Carolina electorate from 1977 (when the Unaffiliated category was first established) until 1988 when the Republicans first opened their primaries up to Unaffiliated voters. Prior to 1988, registrants were welcome to register as Unaffiliated, but doing so would lock them out of voting in any primary.
The Unaffiliated share of registered voters began to grow in 1988, but truly took off in 1996 when the Democrats opened up their primaries as well, creating the semi-closed primary system we have today. In September 2017, Unaffiliated crossed Republican to be the second largest group in North Carolina politics and, as of last week, they eclipsed Democratic registrants.
Parties' Choice
Political parties in North Carolina have considerable control over which voters get to vote in their primaries. After a US Supreme Court decision affirmed the right of state parties to open up their primaries to Unaffiliated/Independent voters, the North Carolina General Assembly followed suit in 1987 by passing House Bill 559, which gave political parties the right open up their primaries if they wished. Almost immediately after its passage, the Republican Party changed their primary rules to allow Unaffiliated voters to participate in their primary, a move that took effect in the 1988 election (first vertical line above)
According to Republican operative Carter Wrenn, the move would "strengthen the Republican Party because a lot of conservative Democrats would support a conservative candidate in the Republican Party." The Democrats were less enamored with the idea. State Democratic Party Chair James Van Hecke argued "That's why we have political parties. If folks want to participate in primaries, they ought to register and be part of a party" (both quotes from articles by the inimitable Rob Christensen).
It was not until 1996 (the second vertical line above when the Democratic Party rolled out the welcome mat to Unaffiliated voters. Even then, though, the view was far from unanimous. Democratic Executive Committee member Lavonia Allison cited fears that Unaffiliated voters, who were mostly white might "dilute the influence of blacks." Others feared "electioneering mischief." The majority Democratic position was perhaps best summarized by Democrat Herbert Hyde who put the decision in starkly political terms, admitting "we have been outmaneuvered by the other party...they have made it look like they are inviting people into their party."
When Did Counties Start to Flip?
By 1996, both parties had opened their primaries to Unaffiliated voters, but the first county did not flip to plurality Unaffiliated until tiny Currituck County made the leap in 2009. Watauga became the second county to go plurality Unaffiliated in 2012, Unaffiliated eclipsed the two major parties in Transylvania in 2014, and Henderson became the fourth county to go plurality Unaffiliated in 2016.
The graph below shows the percent Unaffiliated in the 17 counties where Unaffiliated voters comprise the plurality of voters today (Currituck, the OG Unaffiliated county today has dropped off the list; Republicans (barely)comprise the plurality of Currituck voters today).
North Carolina in Perspective
North Carolina is not alone in experiencing the dramatic rise in registered voters who do not select either of the two major parties. There are 31 states where voters register by party and Unaffiliated/Independent voters can vote in either primary in 22 of them. Unaffiliated/Independent voters are a plurality in 8 of those states, and the second largest group in 9. Clearly this the increasing popularity of Unaffiliated voters is not limited to the Old North State.
|
States With Party Registration & Without Closed Primaries Where Independent/Unaffiliated Voters are the _____ of Voters |
||
|
Plurality (8) |
Second largest group (9) |
Third largest group (5) |
|
AK |
AZ |
LA |
|
AR |
CA |
OK |
|
CO |
IA |
SD |
|
CT |
ID |
WV |
|
MA |
KS |
WY |
|
NC |
ME |
|
|
NH |
NE |
|
|
RI |
NJ |
|
|
|
UT |
|
Registered Voter Analysis: Who Are Unaffiliated NC Voters?
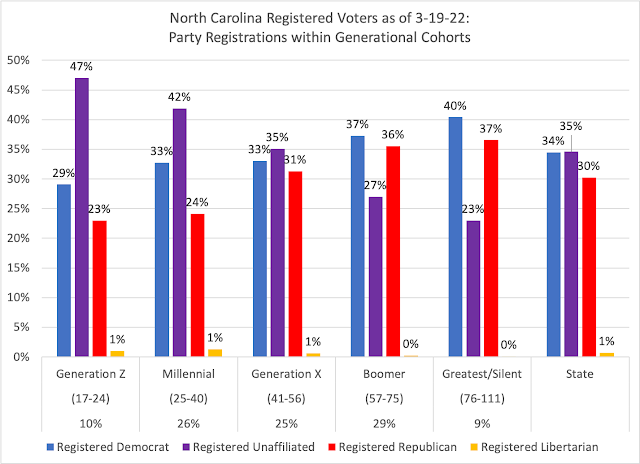
Among North Carolina's Unaffiliated registered voters, distinctive trends are very apparent when compared to the partisan registered voters of Republicans and Democrats. For example, the rise of the NC Unaffiliated is being driven by younger voters: as of March 19, 2022's data, while the median age for Republicans is 53 and the median age of Democrats is 51, the median age for registered Unaffiliated voters is 45. But the 'youngest' party in registered NC voters are the Libertarians, with a median age of 38.
This age differential is also reflected in the generational cohorts within the state's voter pool, as shown by this next chart.
Voters at or under the age of 40 have been the primary drivers of the rise of Unaffiliated voters in North Carolina, with the youngest generation, Generation Z, nearing a majority going with no party affiliation in their registration status. Among older voters, partisan registration dominates, with three-quarters of Boomers and the oldest voters (Greatest/Silent) registering with a party. Generation X serves as a bridge between the respective non-partisan vs. partisan generations and mirroring the state-wide dynamics.
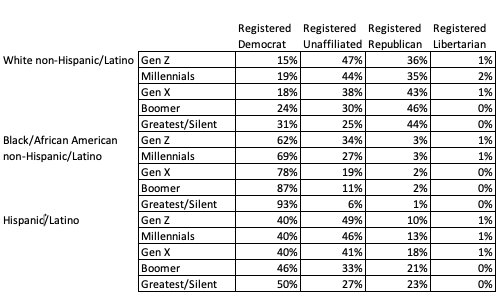
The racial dynamics of North Carolina voters show distinctive trends as well, as noted in the following chart:
Both registered Democrats and Republicans show an 'imbalance' among their voters across the four regions: over 40 percent of Democrats are in the central cities of the state, while 35 percent of Republicans are in surrounding suburban counties. This represents the regional base of both parties.
Only 18 percent of central city voters are registered Republicans, with 45 percent of those city voters being registered Democrats. Among surrounding suburban counties, registered Republicans dominate (nearly 40 percent) while a quarter of those voters are registered Democrats.
Conclusion
--------------------
Dr. Michael Bitzer holds the Leonard Chair of Political Science and a professor of politics and history at Catawba College; he tweets at @BowTiePolitics.
Dr. Christopher Cooper is the Madison Distinguished Professor of Political Science and Public Affairs at Western Carolina University; he tweets at @chriscooperwcu.


